Distributed Data Queries in Analytics: data caching and query push-down to the rescue?

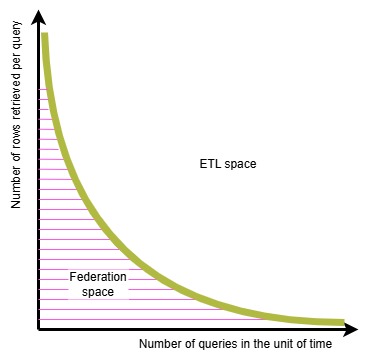
I recently posted about the “federation space” and how there is a sweet spot for the use of data virtualization / data virtualization solutions to perform data analytics.
In the post I promised to discuss two optimization techniques that promise to extend the viability of running queries on distributed data.

Query push down

To anchor the discussion I’ll use a pseudo-code query.
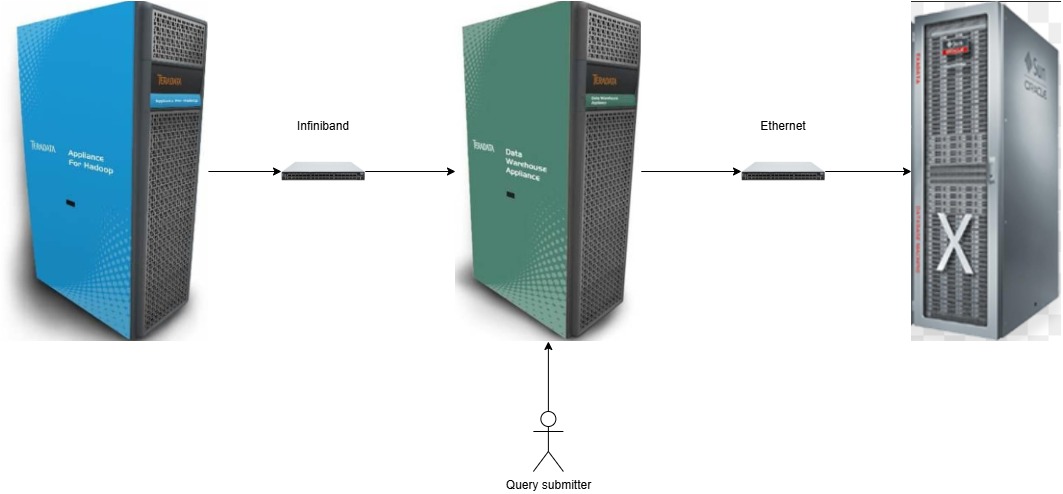
The simplest query on distributed data can be sketched like this:
Select some_calculation from remote_table
For my example I’ll take “some-calculation” to be the average of the value of “column_a” in the remote table containing, let’s say, 10 rows with 10 columns per row.
– The most trivial implementation will perform the sample query by fetching the entire remote_table locally (100 values retrieved) then calculate the average.
– A slightly smarter implementation will push to the remote system the request to send across only the values of column a (10 values retrieved)
– A good, modern implementation will push the entire query to the remote system and retrieve only the desired average (1 value transferred across)

It all looks great in the simple example, but the reality of analytical queries is seldom this trivial.
A slightly more realistic pseudo query might look like the following:
Select customer from remote_spending_table, local_customers_segments_table where customer_spending>2[*average(all_foreign_customers_spending)] and customer_segment="foreign")
The purpose is to retrieve the list of foreign customers that are spending more than twice the average spending of the foreign customers
This generates two challenges:
1) correctly identify the extent of the possible query push down and translate it to the remote system’s SQL dialect (is already not trivial for this small example, just imagine with the 3000-lines-of-SQL generated by the MicroStrategy report of one of my German customers in 2010)
2) getting the owner of the remote system to agree on consuming its resources to execute our query.
Running a simple filter is much lighter than running an aggregation and it’s easier to get an agreement to it.

The second challenge is partly mitigated if the source in the cloud
Thanks to the cloud elasticity the negative impact in the source system can be made negligible or non-existent.
But the topic of who’s paying for the computing costs remains in place (unless it’s a single entity that pays for all the infrastructure costs).

Caching

As soon as a data virtualization project gets adopted the increased load on non-elastic on-premises source systems becomes unacceptable (because the original workload performance is negatively impacted) and the users of the analytics queries start to experience longer response times (because the source system is overwhelmed).
The solution to this challenge is to introduce a caching layer that will store a copy of (part of) the data near the data virtualization system. If properly sized the cache improves the user experience both for the source system’s users and for the people running the analytical queries.
The caching layer also helps reducing the egress costs when consuming data in a hybrid cloud setup. Microsoft’s Blog post about the introduction of S3 caching to OneLake just confirms it.

The first victim of caching is the vision of having “no data duplication (thanks to data virtualization)”, but it is not the only one.

Challenges of Distributed Data Queries in Analytics: the “federation space”

I joined Teradata in 2008.
At the time, inside the organization, the idea of using a data federation solution to run analytics workloads at scale, instead of a traditional ETL/ELT approach, was considered at best extravagant and in most cases plainly nonsensical.

With the arrival of Hadoop this attitude changed because a lot of organization felt IT finally had found the philosopher’s stone of analytics and suddenly the demand to merge the best of the old (database) and new world (Hadoop) soared.
In this context in 2015 I ran my first benchmark of a data federation solution at scale thanks to the recently introduced product called Teradata QueryGrid.
The setup included a Teradata database cluster, an Hadoop cluster, and an Oracle database.

With Teradata and Hadoop nodes connected over an Infiniband network it felt like nothing could stop me from sailing smoothly through the test workloads.
The feeling lasted just until I started to go beyond the functional tests.
With one of the client-provided queries retrieving 300,000,000 (three hundred millions) rows from Hadoop (for each execution) the account team and I quickly became aware of the scalability limits we faced even when working with an infrastructure that was undoubtedly top notch.
The volume of data that needed to be moved was not the only dimension that was pushing the limit of the architecture, but it was the most important of all.
This reality of querying distributed data sets is schematically summarized in the diagram below: the volume of data that needs to be moved can make a distributed architecture not viable.

I didn’t come up with this diagram until 2020: at the time I was in a meeting with my team mates in the AWS ASEAN analytics specialist solution architects (at the time lead by Raja) and we were discussing, among the other topic the recent announcement of Google’s BigQuery Omni running on Anthos.
There was a some concern among the colleagues that the new offering from Google might be a game changer and put us in a difficult spot.
I drafted the diagram to help us all put the announcement in the context of it intrinsic limits.
We were much more relaxed after using it to frame our reasoning.

The diagram above comes without unit of measure on the axis on purpose for two main reasons:
– each organization has a different technology landscape (source systems and interconnects) with different sustainable throughput and this would change the numbers
– the acceptable query response latency moves, ceteris paribus, the yellow curve closer or farther away from the X and Y axis

The careful reader will notice I haven’t mentioned commonly considered techniques to help reduce the load on the interconnection.
I’ll write about data caching and query push down in the next post.

Why the Data Mesh can’t and shouldn’t replace data integration

A few weeks ago, I wrote that Self-service analytics isn’t everyone’s dream and a few days later I discussed the content with my friend Alessio.
It turned out that one of the points I was trying to make didn’t come out as sharply as I believed, and this post is to elaborate on it and make it clearer.

  1. Data self-service is more feasible and cost-effective with a proper Data Mesh than with most 1st generation data lakes.
  2. Adopting the Data Mesh model doesn’t imply that data integration efforts should be halted.
    I see at least three reasons why data integration initiatives should continue:
    a) The cost of finding, understanding, and processing data from multiple sources is lowered when adopting the Data Mesh, but when the same activity is repeated multiple times by hundreds or thousands of employees the cumulative cost will become greater than the cost of integrating the data once for everyone.
    b) When each person or small team integrates the data autonomously the potential outcome is a Babel of numbers that don’t match those created by other teams and the organization ends up with a modern edition of the spread-mart proliferation of the past.
    Until the results are incorporated in a PowerPoint document this modern version removes the problem of the stale data, but it’s a small consolation.
    c) Truly federated analytical queries can’t guarantee, at least today, the low latency needed in many business scenarios.

In the previous paragraph I mentioned the cost of producing valuable knowledge from data, but I didn’t dig in the detail of computing such cost.
I tried to come up with a nice construct for it all I can offer so far is a small WIP to hopefully start a little brainstorm.
The cost of knowledge production (CoKP) is a function of computing costs and human effort.
– The computing component appears relatively simple but paying attention to the efficiency of the data processing is key when queries are executed at scale.
I’ve seen >100K analytical queries per day in production environments in several clients: this is what happens when and analytical platform is successful in generating value. It’s better to plan ahead of time rather than ending up forced to re-think the architecture by skyrocketing costs and potentially losing momentum and motivation in the process.
– In the human component I’d include the time needed to find the data, get access, understand what the specific data means, understand the fit for the specific purpose, and processing the data to extract the knowledge.
I know that cost in itself is not enough to evaluate an investment but estimating the return of an investment in data transformation is complex and I don’t dare taking a stab at it here.

I take the opportunity to do a couple of follow-up on comments related to this subject I’ve received recently:
– My friend Dan suggested that IT should be the group doing the data integration.
I’m not sure it has to be IT; they might have a better visibility of the overall data landscape and thus be in a better position that other organizations, but I’d say today there should be a chief data officer (CDO) to lead the data integration initiative.
Gaetano‘s reply to my comment a week ago seems to go in the same direction of seeing IT as the agent enabling cross-domain pollination.
Andrea kindly pointed out an improper use of the term “insight” on my side.
I’m pretty sure my former colleague Dirk would completely agree with him, and I’ll do my best to be more rigorous with the terms I use.

As usual…